 hamster-bot
HiDeep
This strategy came out of long thinking about how to improve the mean reversion | MRS | Envelope strategy, and those improvements turned into a separate strategy.
Key fundamental differences from MRS:
● works only with market orders. The price at which the buy/sell will happen is not known in advance, so nothing can be placed ahead of time
● all actions happen at the moment the candle closes. This gives a very simple, robust strategy logic that backtests very well even in primitive strategy testers
● a non-obvious consequence of the point above - much better survival of the strategy during sharp moves within a single candle. Nothing happens inside the candle, even if the candle makes an 80% price move.
● the strategy uses the MRS logic as one of the conditions (a filter) for triggering an order.
● unlimited averaging in.
It is a counter-trend strategy that looks for moments of local oversold conditions and opens buys on pullbacks down, expecting a subsequent bounce.
It combines:
● entry filtering with a moving average (as in the strategy above - Mean reversion | MRS)
● analysis of the price deviation from the average
● a simple oversold model (similar to RSI). The price falls faster than usual.
● exit on signs of price recovery (the mirror-opposite of the buy conditions)
The strategy tries to catch a situation where:
● The price has dropped sharply
● The move looks "overloaded" (too strong compared to normal)
● There are signs of short-term oversold conditions
At such moments it assumes the market has temporarily overshot downwards and may bounce.
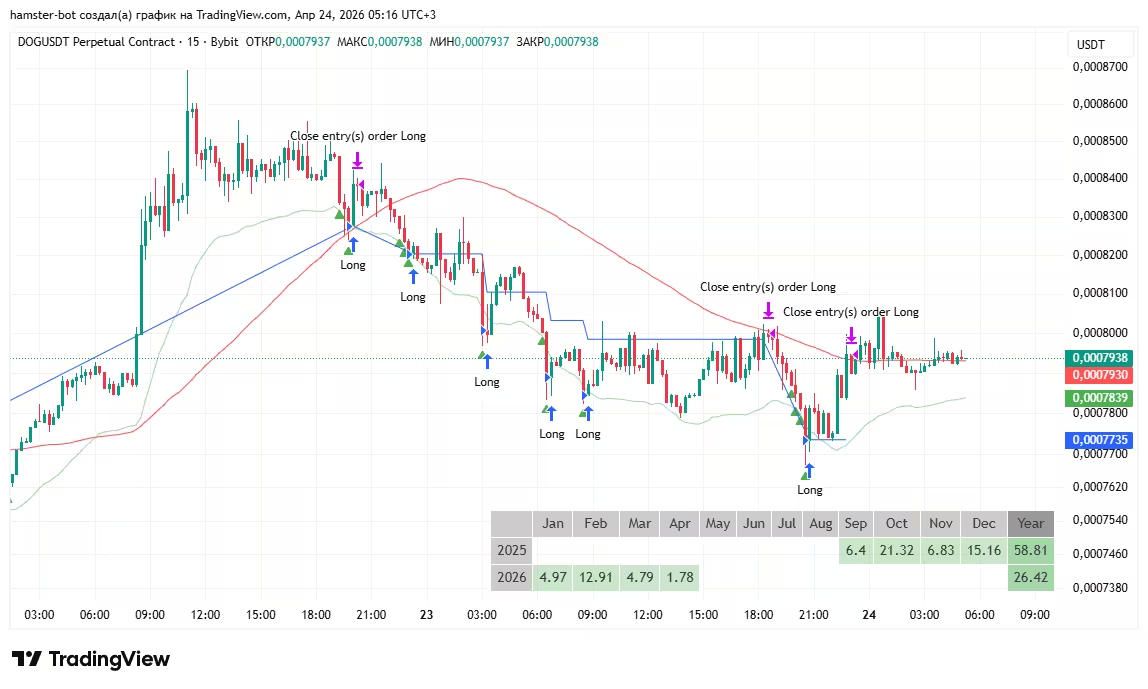
An example of a HiDeep strategy variation on the chart above.
Long entry and subsequent averaging in on candles that are:
● below the green trigger MA line shifted down
● marked with a green triangle ▲
The position closes when the High touches the red MA line. (action at the candle close)
The blue line shows the average buy price.
⚠️ In a prolonged decline without a bounce, the position keeps growing through averaging in and the loss grows. Limit the number of averaging entries and the lot size.
How the signal is determined (green/red triangle)
A buy signal (green ▲) appears on a candle that at the same time:
● is red (closed below its open)
● has its body below the body of the previous candle
● has a deviation of the close price from the SMA larger than the average deviation over recent candles (the move is "overloaded")
● has a fast RSI below 10 (strong short-term oversold)
A sell signal (red ▼) is the mirror: a green candle, body above the previous one, a strong upward deviation, fast RSI above 90.
Signals are calculated with two independent sets of settings, and either one triggers. In addition, the close price must be below the MA low line (for a buy) or above MA high (for a sell).
Parameters
MA lines
ma_low_*,ma_high_*- type, length and source of the entry filter lines. ATR can be used instead of an MAma_low_1,ma_high_1- offset of the filter lines. 0.995 - 0.5% lower, 1.011 - 1.1% higherma_high_trigger_*,ma_low_trigger_*- closing trigger lines: long closes when the candle High is abovema_high_trigger, short when the Low is belowma_low_trigger
Signal
up_1,dn_1,mac_1,sma_1,sma_up_1,sma_dn_1- first set: fast RSI length up/down, SMA length for the deviation, deviation averaging length, threshold multipliersup_2...sma_dn_2- second set with the same parameters
Averaging in and closing
count_max_long,count_max_short- maximum number of entries into the position, including the first (default 5)entry_gap- minimum averaging step: the next buy only if the price is below the previous buy price *entry_gap. For example 0.98 - no closer than 2%. 0 - no limitonly_profit,min_profit- close on the trigger line only in profit.min_profit- multiplier to the entry price, e.g. 1.01 - profit of at least 1%allow_reduce- close the position on the opposite signal (for long - on the red ▼)reduce_ma_1- close on the opposite signal only if the price is beyond the opposite MA lineallow_reverse- on the opposite signal, reverse the position instead of just closing it
Modes
use_pdd- inverted mode: buy on an overbought signal above theMA highline, sell on an oversold signal belowMA low. The strategy becomes a momentum strategydisable_trade_on_reverse_trend- with the trend filter enabled, do not open trades on the candle where the trend changeduse_auto_size_hedge,auto_size_hedge_ratio- automatic size for hedging. The entry size depends on the total size of trend positions of other bots on this account: the more trend shorts, the bigger the HiDeep buy, and vice versadelay- pause between checks in ms (at least 3000)
The bot starts trading only when enough candles are loaded to calculate the indicators. With the trend filter enabled, at least 500 candles are needed.
Backtest
Test in the built-in backtester
Scripts (PineScript) for testing the strategy on historical data in the TradingView strategy tester. The hamster-bot-HiDeep script contains three different variants of the strategy - pick the one you need with a preset in the settings.
Backtest the strategy on historical data in the tester and run it in hamster-bot.