 hamster-bot
 Testing trading strategies on historical data
A reliable portfolio backtest. Quant-research level 
 first run of the tester
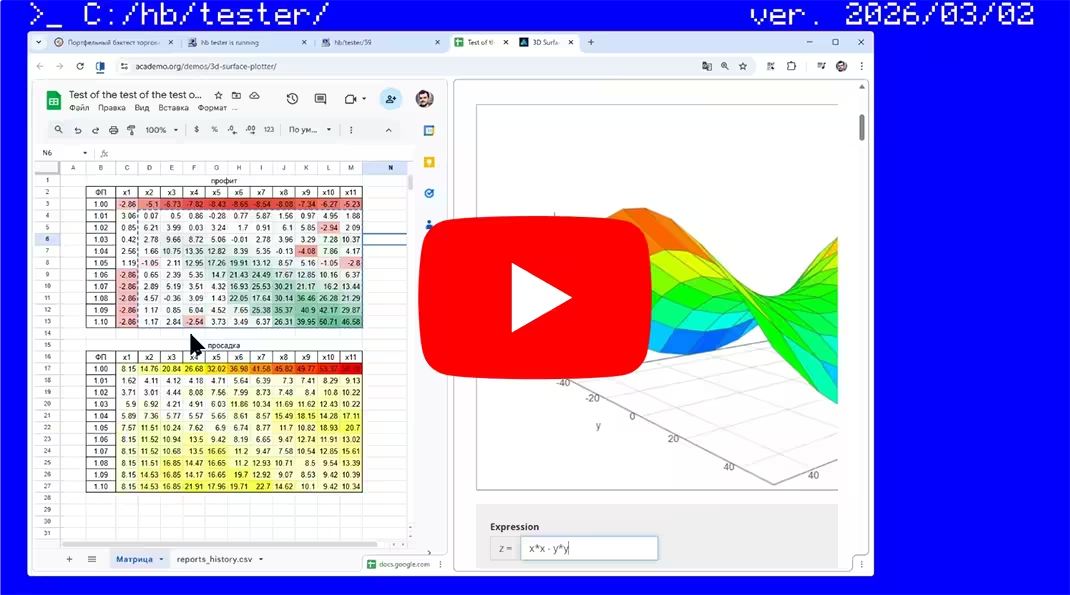 update overview and parameter
optimizer
update overview and parameter
optimizer
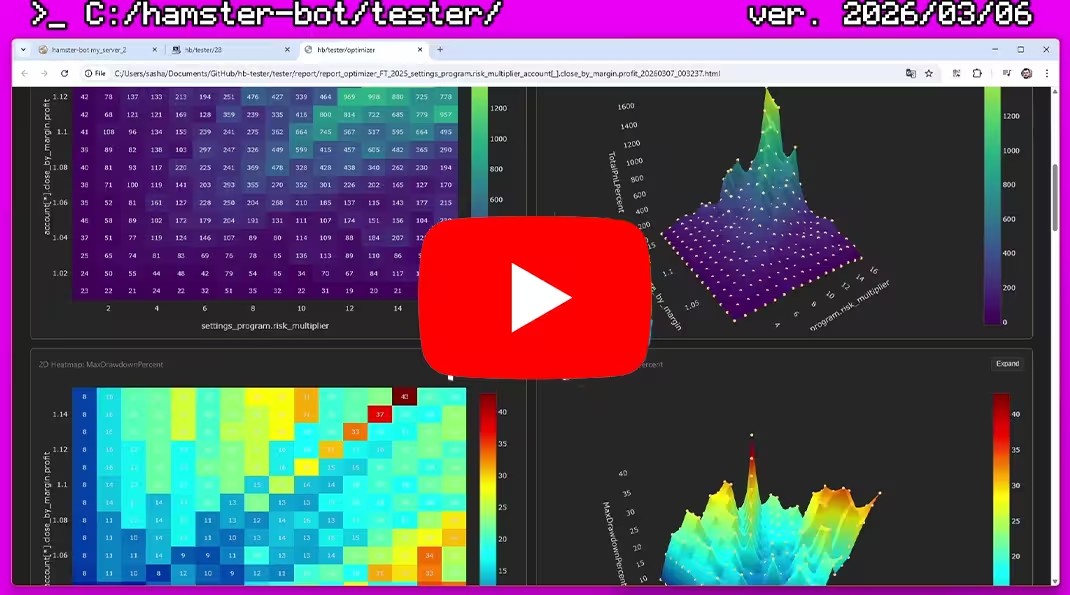 Sweep and analysis. building heatmaps and
3d surface
Sweep and analysis. building heatmaps and
3d surface
 instructions for running tests. sweeping trading pairs
 guide to the new tester web interface
hamster-bot/tester - an advanced tool for testing your trading systems on historical data.
 Backtester features:
- Portfolio test. Several strategies of different types on different pairs and timeframes at once — on a single shared balance with cross margin. You can see how the strategies coexist on one wallet: total deposit load, overall drawdown, overlapping positions.
- The same production code. The backtest runs the same code the bot trades with in real time: strategies, position service, position limiter, account options. No rewriting of logic for the tester.
- Honest simulation inside the candle. 1-minute step: the strategy is called every minute and sees the forming candle, orders are checked against the High/Low of every minute. Trailing stops, moving orders and exits inside the candle work just like in live trading. (Optionally, a more detailed simulation with tick precision can be enabled)
- Realistic costs. Maker/taker fees, slippage on market and stop orders, funding, limit order fills capped by candle volume.
- Data is downloaded automatically. BYBIT, BINANCE, MEXC (spot and futures) and BITMEX — for any historical period. You can also supply your own data in CSV.
- Detailed interactive report. Equity curve, monthly returns heatmap, trade charts for each pair and more than 50 metrics: Sharpe, Sortino, Calmar, CAGR, Recovery Factor, win/loss streaks, deposit load, etc.
- Parameter optimizer. Sweep any settings of the bot, strategies, account and the tester itself. Parallel runs on all cores, Monte Carlo sampling for huge parameter spaces, portfolio pair selection without repeats. Results — in a summary table and on heatmaps / 3D surface.
- Testing your own complex logic that can't be accurately tested with off-the-shelf third-party solutions without workarounds.
Implemented as a separate connector  to an "exchange" (a mock object replacing the exchange). This way, all the bot's
already-written code can be tested. The bot thinks it's working on a real exchange (places orders, gets balance and
position info). And this virtual exchange stub calculates everything and generates the report.
to an "exchange" (a mock object replacing the exchange). This way, all the bot's
already-written code can be tested. The bot thinks it's working on a real exchange (places orders, gets balance and
position info). And this virtual exchange stub calculates everything and generates the report.
 Market data for
testing
Market data for
testing
Crypto exchanges publicly share historical market data. The tester downloads the needed data range itself,
builds 1-minute candles from it, and then builds bars of the required timeframe for the bot from those
minutes. No manual steps or registration required.
In addition, WarmupDays days before the test start are downloaded, so all of the strategy's TA
indicators are calculated by StartDate.
Supported exchanges. The exchange is taken from the strategy settings file:
settings.exchange.name.
- BYBIT — futures (
bybit) and spot (bybit-spot). Archives of all trades frompublic.bybit.com. - BINANCE — USDT-M futures (
binance,binance-papi) and spot (binance-spot). Daily archives of aggregated trades fromdata.binance.vision. - MEXC — spot (
mexc) and futures (mexc-futures). Ready-made 1-minute candles via the exchange's public API. - BITMEX — (
bitmex). Daily trade archives frompublic.bitmex.com. One file contains trades for all pairs at once — the tester downloads it once and splits it into per-pair folders.
If an exchange without a downloader is specified, the tester uses BYBIT data.
Storage. Data is saved in the  folder
 tester/data/{exchange}/{symbol} — one file of 1-minute candles per day
in Parquet format (2026-02-03_1m.parquet, for BitMEX 20260203_1m.parquet). The files
are compressed and take less space than CSV. Downloaded trade archives are deleted after conversion to save space.
Days that were already downloaded are not downloaded again: on subsequent tests the tester only fetches the
missing days (if UpdateData = true). With UpdateData = false the test runs only on the
data already in the folder.
During a parallel sweep the processes don't interfere with each other: only one process downloads a given
pair at a time, the others wait and use the finished files.
When a test starts, only the daily files for the test period (including warm-up) are read. Files without a
date in the name are not read.
Data in the old CSV format. Data downloaded by earlier bot versions (*_1m.csv) doesn't
need to be downloaded again: on the first test of a pair the tester converts its CSV files to Parquet and
deletes the CSV. To convert the whole tester/data folder at once, use
run_convert_data.bat (on macOS, run_convert_data_mac.sh) in the bot's folder: it
runs the bot with the --convert-data flag. It can also be run while the tester is working.
Your own data. You can drop your own data in CSV format into the
tester/data/{exchange}/{symbol} folder. On the first test of that pair (or via
run_convert_data.bat) the tester converts it to Parquet and deletes the original CSV, so keep a
copy if you need it. Requirements:
— one file per day, the name ends with the date and _1m.csv, e.g. 2026-02-03_1m.csv
(files without a date in the name are not read);
— 1-minute candles (the tester walks through history in 1-minute steps / optionally it can run on every tick,
but that is slow);
— the first line is a header, followed by the columns timestamp,open,high,low,close,volume (other
columns are ignored; if there are 9 or more columns, columns 7–9 are read as
buy_volume,sell_volume,trades);
— timestamp in UTC: unix time in seconds, milliseconds, microseconds or nanoseconds (the format is
detected automatically), or a date string 2026-02-03 00:01:00;
— columns are separated by commas, the decimal separator is a dot.
Example:
timestamp,open,high,low,close,volume
1770076800000,97512.5,97540.0,97480.1,97530.2,12.345
1770076860000,97530.2,97561.7,97522.0,97555.0,8.910
Pre-downloading. The run_download_data.bat file in the bot's folder runs the bot with the
--download-data flag. In this mode the tester doesn't test anything, it only downloads all the
data needed for the test period (+ warm-up) for all pairs from tester/settings_strategy, including the
pairs from the parameter_mining sweep. Handy to run in advance before a large sweep.
 Tester
behavior
Tester
behavior
From the bot's point of view, the tester is just another exchange. The bot connects to it and starts receiving bars, placing orders, etc. Meanwhile the tester simply emulates the behavior of a real exchange.
Time and candles. The tester walks through history in 1-minute steps, synchronously across all trading
pairs. From the minutes it builds candles of the strategy's working timeframe (1m, 5m, 15m, 30m, 1h, 2h, 4h,
6h, 8h, 12h, 1d, 1w) aligned to UTC, just like on the exchange: 1h candles start at XX:00, 4h — at
00:00/04:00/08:00…, 1d — at 00:00 UTC, 1w — on Monday 00:00 UTC.
The strategy is called every minute, not only at candle close — for the 1h timeframe that's ~60 calls
per candle. The bot receives closed bars and the current forming candle, whose OHLC is updated every
minute. So logic that depends on the price inside a candle (trailing stops, moving orders, exiting at the
current price, etc.) works the same as in live trading.
Bars of the warm-up period (WarmupDays) are only used to calculate indicators — trading starts at
StartDate. If a minute is missing from the data (no trades), the tester inserts an "empty" candle
at the last price.
Order execution. On each 1-minute candle the tester checks all pending orders against its High/Low:
market— filled immediately at the current price with slippage (SlippagePercent): buys fill higher, sells fill lower. Taker fee.limit— filled at its own price once the minute's price reaches it (Low ≤ price for a buy, High ≥ price for a sell). Maker fee. WithLimitOrderVolumeCheck = truethe filled amount is limited by the volume of the 1-minute candle — partial fills are possible, the remainder waits for the next candles.stop/stop_market— triggers when the trigger price is touched and is filled at that price with slippage. Taker fee.stop_limit— activated by the trigger and filled at the limit price if it is also reached within that minute. Maker fee.take_profit— filled at the trigger price when it is reached. Taker fee.
Orders can be modified (price, size, trigger) and cancelled — just like on the exchange.
reduceOnly is supported: such an order can only reduce a position and will never flip it. The
strategy's use_long/use_short settings are respected: if a direction is disabled, an
order in that direction can only close the opposite position, and the "excess" size is cut off.
Positions. One-Way mode (one position per pair): a buy while short first closes/reduces the short, and the excess opens a long (a flip). When adding to a position, the entry price is averaged. PnL is realized on every close or reduction of a position.
Balance is shared across all strategies. Behaves like BYBIT/BINANCE futures with cross margin. The bot
can request the Wallet or Margin balance:
— Wallet — realized balance: initial balance + realized PnL − fees ± funding;
— Margin (equity) — Wallet + unrealized PnL of all open positions. The equity curve and the
maximum drawdown are based on it.
The fee is deducted from the balance immediately on every order fill.
If the Margin balance drops to zero, the tester stops the run — the deposit is "blown", there is no point
testing further.
Funding. Every FundingIntervalHours hours (UTC, at the start of the hour) funding is
applied to all open positions: position size × price × FundingRate. With a positive rate, longs
pay and shorts receive. The totals are shown in the report (Funding paid / received / net). To disable
funding, set FundingRate = 0.
Bot logic. The tester runs the very same logic as live trading: the position service, the limiter of simultaneously open positions, account options (e.g. closing on margin profit) — all of this is the bot's shared production code.
 Report
Once testing is finished, a detailed interactive HTML report is saved to the folder
tester/report/{name_comment}.
And a record is added to reports_history.csv with summary information about the test, for easily
finding the best parameter combinations when optimizing strategies.
Optimizer report. When sweeping parameters (parameter_mining), in addition to the report for
each run, the tester builds one more, summary report report_optimizer_*.html across all runs at
once. It shows the sweep results as heatmaps and 3D surface charts: the X and Y axes are the values of the swept
parameters, the Z axis is the metrics (return, drawdown, Profit Factor, etc.). This way you immediately see
stable "plateaus" of good values rather than isolated random peaks. The report is created automatically during
a parallel sweep (max_parallel_runs > 1) or manually via run_report_optimizer.bat,
see the "Optimizer" section for details.
Report header — key metrics:
Pairs- number of trading pairs (strategies) in the testInitial Balance/Final Balance- starting and ending balance in USDTTotal PnL- total profit/loss in USDT and %Total Trades (Win/Los)- number of trades, of which profitable and losingWin Rate- percentage of profitable tradesMax Drawdown- maximum drawdown in USDT and %Total Fees- total fees paidPosition avg (max), %- average (and maximum) total size of open positions as % of the Margin balance. Shows how heavily the system loads the depositProfit Factor- ratio of gross profit to gross lossDuration (days)- length of the test period in days
Charts:
Equity Curve- chart of the Margin balance (accounting for all open positions and unrealized PnL) and the Wallet balance. TheLiquidation Levelline (toggle it in the legend) is the cross-margin liquidation level, roughly as in Bybit UTA: the total maintenance margin of open futures positions in USDT (notional × risk-limit tier MMR − mmDeduction + taker fee to close). If the Margin balance falls below this line, a real exchange would liquidate. Risk-limit tiers are downloaded from Bybit; for other exchangesmaintenance_margin_ratefromconfig_tester.jsonis used. Chart only, it does not stop the testMonthly Returns Heatmap- heatmap of returns by month and the total for each yearOpen Positions Size- total size of open positions in USDT: overall, longs and shorts separately, and split by trend and counter-trend strategiesStrategy Charts- separate candlestick charts for each strategy with trade markers and the strategy's TA visualizationRealized PnL by Symbol- cumulative realized PnL for each pair and in total
Report Statistics — detailed statistics:
- Period & Scope (test period)
Report range- test start and end datesDays in test- number of days in the testMonths in test- number of calendar months the test coversMonths with data- number of months for which the return was calculatedPairs count- number of pairs (strategies)
- Balance & Equity (balance)
Initial balance/Final balance- starting and ending balanceMin balance/Max balance- minimum and maximum Margin balance over the whole test
- Monthly Performance (monthly returns)
Average monthly return (geometric), %- average monthly return with compounding (reinvestment). The most honest estimate of "how much per month on average"Average monthly return (arithmetic), %- simple arithmetic mean of monthly returnsBest month, %/Worst month, %- best and worst month
- PnL, Volume & Fees (profit, volume and fees)
Total PnL/Total PnL, %- total profit/loss in USDT and %Gross profit- sum of all profitable closes (gross profit)Gross loss- absolute sum of all losing closes (gross loss)Trading volume (USDT)- total trading turnoverTotal transactions (buy/sell)- total number of order fills (buys and sells)Total fees- total fees paidFunding net- net funding (received minus paid)Funding accrued (received)- how much funding was receivedFunding paid- how much funding was paid
- Trades (trades)
Total Trades/Win Trades/Los Trades- total, profitable and losing tradesWin Rate, %- percentage of profitable tradesExpectancy per trade- expectancy: the average result of one trade in USDT ((gross profit − gross loss) / number of trades)Max consecutive wins/Max consecutive losses- longest streak of profitable and losing trades in a row
- Risk & Exposure (risk and deposit load)
Position avg / max, % of margin balance- average and maximum total size of open positions as % of the Margin balanceLong / Short Position avg / max, % of margin balance- the same, separately for longs and shortsMax Drawdown/Max Drawdown, %- maximum drawdown in USDT and %
- Risk by strategy (deposit load by strategy type)
T ...- average and maximum position size (overall, long, short) of trend strategies as % of the Margin balanceCT ...- the same for counter-trend strategies
- Risk-Adjusted Ratios (return/risk ratios)
Profit Factor- gross profit / gross loss. Above 1 means the system is profitableRisk/Reward- average winning trade / average losing tradeRecovery Factor- Total PnL / Max Drawdown. How many times the profit covers the maximum drawdownSharpe ratio (monthly)- Sharpe ratio based on monthly returns (annualized). Return relative to overall volatilitySortino ratio (monthly)- Sortino ratio. Like Sharpe, but only takes downside volatility (drops) into accountCAGR, %- compound annual growth rate of capitalCalmar ratio- CAGR / Max Drawdown %. Annual return relative to the maximum drawdown
Details — detail tabs:
Settings- settings of all strategies that took part in the testTrades- tables with all trades for each pair: time, order, strategy, side, action, size, price, fee, PnL, balance, position after the trade, position value in USDT and as % of the Margin balanceMarkets- instrument parameters: instrument type (Type: on Bybitcrypto,stock,ETF,commodity,forex, etc.), maximum market order size, maximum leverage, lot step, current price and average daily trading volume over 1, 10 and 100 daysSummary- summary table for each pair: number of trades, Win Rate, Profit Factor, PnL, fees, trading volume, average and maximum position size in %Tester Config- tester parameters and the values of the swept parameters for this run, plus the account optionsclose_by_margin,open_positions_limiterandrisk_multiplier
 Tester
parameters
Tester
parameters
file: config_tester.json You can edit the file in a text editor.
name_comment - a comment for the test. To make it easier to navigate reports. Reports are saved
to a separate folder tester/report/{name_comment}.
InitialBalance - the starting balance for testing, in USDT
StartDate - the test start date in the format 2026-02-03T00:00:00
EndDate - the test end date in the format 2026-02-13T00:00:00
WarmupDays - number of days to warm up before testing begins. Data for these days is downloaded
in addition, before StartDate, so the TA indicators are calculated by the start of testing.
MakerFee - maker fee (0.0001 = 0.01%) Standard on BYBIT: 0.00036 = 0.0360%.
(a guide on how to significantly reduce fees)
TakerFee - taker fee (0.0001 = 0.01%) Standard on BYBIT: 0.001 = 0.1000%
SlippagePercent - slippage for market orders (0.0001 = 0.01%)
LimitOrderVolumeCheck - volume check for correct execution of limit orders (true/false). A limit
order is filled no more than the volume of the current candle allows: the tester "bites off" the available
volume from the order, and the remainder waits for the next candle (partial/step-by-step fill). If off — the
limit order is filled in full when the price is touched.
FundingRate - Funding rate size (0.0001 = 0.01%)
FundingIntervalHours - Interval between funding payments in hours (8)
maintenance_margin_rate - maintenance margin rate as a share of position notional (default
0.005 = 0.5%). Used for the Liquidation Level line on the balance chart when the exchange
provides no risk-limit tiers (currently tiers are downloaded only from Bybit). Does not affect the test itself.
Per-strategy trading window: add "tester": { "StartDate": "...", "EndDate": "..." } to a strategy
settings file. Before StartDate the strategy does not trade; after EndDate the tester
cancels its orders and closes its position once. Either field can be omitted.
accounts - the tester account. The first item is used: close_by_margin and
open_positions_limiter for all strategies in the test come from it. No API keys needed. If the
section is missing, a default account is created (options off):
"accounts": [ { "name": "tester", "open_positions_limiter": 0, "close_by_margin": { "profit": 1.0,
        "loss": 1.0, "size": 1.0, "each": false } } ]
Strategy files for the tester live in their own folder tester/settings_strategy, separate from the
live settings_strategy. All files in it are tested; exchange.account is ignored. In the
bot web UI (Tester → Table) you can add, copy, edit and delete tester settings, download data, run the wizard
or full parameter mining; the Files tab is a file manager for tester/runs,
tester/report and tester/data, where a run snapshot can be edited and re-run.
UpdateData - update (download missing) market data before testing (true/false)
use_logger - whether to use the logger. If off, testing runs faster (true/false)
max_parallel_runs - number of parallel tester runs when sweeping parameters. Each run is started
as a separate process. If the computer's performance allows it, processes can be parallelized without losing
calculation speed. With a value greater than 1, the summary optimizer report (heatmaps / 3D surface) is built
automatically after all runs finish.
single_mode - separate testing mode (true/false). If on, each settings file from the
tester/settings_strategy folder is tested separately rather than all together on a shared balance. Handy
for evaluating each strategy/pair separately in a single launch. The parameter_mining sweep is
applied to each strategy.
use_runs - run tests from saved snapshots (true/false). If on, the tester ignores the current
settings and runs all *.json files from the tester/runs folder one after another. Each
file is a full snapshot (strategies, program settings and tester settings, including the tester account in
accounts). This mode works only when launched from the console (--run-tester): the
Parameter mining button ignores it, and a single snapshot is run in the web interface with the
Run button on the "Files" tab. The tester saves such snapshots,
run_snapshot_{name_comment}.json, to the report folder itself after a parallel sweep — you can copy
them to tester/runs to repeat them or queue several different tests.
shuffle_miner, monte_carlo, monte_carlo_seed - additional optimizer
modes, described in the "Optimizer" section.
file: config_tester.json/report Report content settings:
enable_html_report - create the HTML report (true/false). If off — no HTML is generated, only a
row with summary metrics is added to reports_history.csv. Greatly speeds up large parameter sweeps
and saves disk space.
chart_ohlc_height - OHLC chart height in pixels
chart_balance_height - balance chart height in pixels
chart_position_height - open position size chart height in pixels
include_chart_ohlc - include the OHLC chart in the report (true/false)
include_chart_balance - include the balance chart in the report (true/false)
include_chart_position - include the open position size chart in the report (true/false)
include_settings - include strategy settings and tester parameters in the report (true/false)
include_trades_table - include tables listing trades for each strategy (true/false)
include_summary_table - include the summary table for all strategies: trading volume, fees, etc.
(true/false)
include_monthly_returns_heatmap - include the monthly returns heatmap (true/false)
include_position_stats - include open position statistics: average and maximum size of open
positions as % of the Margin balance (true/false)
enable_timing_logs - print to the console the generation time of each report stage. Useful for
diagnostics if reports take a long time to build (true/false)
 Optimizer
(parameter sweep)
Optimizer
(parameter sweep)
The optimizer automatically runs the test many times, each time with a new combination of values of the
selected parameters. The result of each run is written as a separate row to the summary table
tester/report/{name_comment}/reports_history.csv: the test metrics plus columns with the values of
the swept parameters. Sorting it makes it easy to find the best combinations.
file: config_tester.json/parameter_mining Optimizer (parameter sweep)
settings:
By default this is an empty list [] — a regular single test. The list is filled with objects like
{"name": "parameter_name", "start": 1, "end": 10, "step": 0.5, "values": []}. Each object is one
swept parameter.
name - path to the parameter to sweep. You can specify any bot setting. The path starts with one
of 4 kinds of config:
1) settings — strategy settings (.json files in the tester/settings_strategy folder).
Here we configure: the trading pair, the timeframe, deposit handling, and which strategy runs with which
settings.
Example: settings[*].mrs2.ma_long.type - sweeps the type parameter of the opening
order for the mrs2 strategy
2) account — the tester account (the accounts section in
config_tester.json).
Here we configure the account-wide take profit by margin balance or the limit on the number of simultaneously
open positions.
Example: account[*].close_by_margin.profit - sweeps the profit parameter of the
close_by_margin option
3) settings_program — general bot program settings (the
settings_program.json file). Here we configure the overall lot size multiplier
risk_multiplier.
Example: settings_program.risk_multiplier
4) config_tester — settings of the tester itself (the config_tester.json
file). For example, you can run tests with different fee or slippage levels.
Example: config_tester.MakerFee
Selecting a specific strategy/account. Square brackets specify which files to apply the parameter
to:
settings[*] — to all settings files at once
settings[0] — only to the first file (numbering starts at 0, in load order)
settings[my_set_btc] — only to the file whose name field equals
my_set_btc
The same works for account[...] and for nested lists inside the settings (e.g. [*],
[0] on a list of orders).
start - starting value of the parameter
end - ending value of the parameter (inclusive). You can also sweep in descending order if
start > end
step - step size for the parameter
values - an explicit list of values to sweep. If the list is not empty,
start/end/step are ignored. Values are written as strings and are
automatically converted to the parameter's type: text, numbers ("5", "10", "25"), true/false
(["true", "false"]) and option lists (enum).
For example, for the moving average type the available values are:
["SMA", "EMA", "GMA", "HARMONIC", "TEMA", "DEMA", "ZLEMA", "WMA", "VWMA", "RMA", "EHMA", "THMA", "HMA", "DMA", "ATR", "H", "L", "SMA_KALMAN", "EMA_KALMAN", "GMA_KALMAN", "HARMONIC_KALMAN", "TEMA_KALMAN", "DEMA_KALMAN", "ZLEMA_KALMAN", "WMA_KALMAN", "VWMA_KALMAN", "RMA_KALMAN", "EHMA_KALMAN", "THMA_KALMAN", "HMA_KALMAN", "DMA_KALMAN", "ATR_KALMAN", "H_KALMAN", "L_KALMAN"]
For the price source:
["open", "high", "low", "close", "hl2", "hlc3", "ohlc4", "hlcc4", "oc2"].
For sweeping a list of trading pairs - see Example 1.
Name validation. Before starting, the tester checks every name. If no parameter with that
path is found (a typo, no such strategy, etc.), a warning is printed to the console:
[MINER] Обнаружены невалидные parameter_mining.name ("invalid parameter_mining.name found"), and
that parameter is not applied — the tests will run with the original value. Always check the console on the
first run of a sweep.
Number of runs is the product of the number of values of all parameters. If you set two parameters
to sweep, for example from 1 to 10 with a step of 1, 100! runs will be performed (10 variants of the first
parameter × 10 variants of the second parameter). The results of all tests are saved as separate html reports
and in the reports_history.csv summary table.
Tips for a large sweep:
— turn off HTML reports (report.enable_html_report = false) and the logger
(use_logger = false) — this greatly speeds up runs and saves disk space;
— increase max_parallel_runs to match the number of CPU cores;
— if there are too many combinations, use monte_carlo (see below).
Additional sweep modes (file: config_tester.json):
single_mode - each settings file from tester/settings_strategy is tested separately, and the
whole parameter_mining sweep is run for each of them. For example, 5 settings files × 20
combinations = 100 runs. Handy when you need to tune parameters for each pair independently rather than for
the portfolio.
shuffle_miner - sweeping trading pairs without repeats across strategies (true/false). Works when
the tester/settings_strategy folder has several settings files and parameter_mining has a
parameter like settings[*].... (e.g. settings[*].basic.symbol). Instead of giving all
strategies the same value, the tester hands them different values from the list and goes through all
unique combinations. Example: 3 settings files and 10 pairs in values → C(10,3) = 120 runs, in each
of which the strategies trade different pairs. Lets you find the best set of pairs for a portfolio on a shared
balance.
monte_carlo - limit the number of runs by random sampling (0 = off). If the total number of sweep
combinations is greater than this value, the tester picks monte_carlo random combinations instead
of the full sweep. Useful when there are millions of combinations: you can quickly "probe" the parameter space
and then narrow the ranges around the best results.
monte_carlo_seed - seed of the random number generator for Monte Carlo (default 42). With the same
seed the sample is repeated; change it to get a different sample.
file: config_tester.json/report_optimizer Summary optimizer report:
After a parallel sweep (max_parallel_runs > 1) the tester automatically builds the
report_optimizer_*.html report from reports_history.csv. You can also build it
manually — for example after a sequential sweep, or to rebuild it with different z_parameters: the
run_report_optimizer.bat file (the --run-report-optimizer flag) takes the
tester/report/{name_comment} folder, or the folder passed as the first argument.
— if 2 or more numeric parameters were swept — heatmaps and 3D surface charts. The X and Y axes show the two
numeric parameters with the most values, the Z axis shows the selected metrics;
— if 1 numeric parameter was swept — line charts of the metrics against that parameter;
— if trading pairs were swept at the same time — charts are built separately for each pair;
— if there is nothing to build charts from — a table of all results is shown in the report.
chart_height - height of the optimizer charts in pixels (550)
z_parameters - list of metrics for the Z axis. Default is
["TotalPnLPercent", "MaxDrawdownPercent", "ProfitFactor"]. You can use any numeric columns from
reports_history.csv: TotalPnL, TotalPnLPercent,
FinalBalance, TotalTrades, WinRate, MaxDrawdown,
MaxDrawdownPercent, TotalFees, PositionAvgPercent,
PositionMaxPercent, ProfitFactor.
Example 1: sweeping trading pairs
parameter_mining is a list ([]) to which sweep objects are added, separated by
commas ([{}, {}]).
To sweep trading pairs, use the string parameter values, while the numeric fields
start/end/step are set to 1.0 (they are ignored when
values is not empty).
The parameter settings[*].basic.symbol will be applied to all settings files in the
tester/settings_strategy folder:
"parameter_mining": [
    {
        "name": "settings[*].basic.symbol",
        "start": 1.0,
        "end": 1.0,
        "step": 1.0,
        "values": [
            "1000BONKUSDT", "1000FLOKIUSDT", "1000LUNCUSDT",
            "1000NEIROCTOUSDT", "1000PEPEUSDT", "1000TAGUSDT",
            "4USDT", "AAVEUSDT", "ACHUSDT", "ADAUSDT"
        ]
    }
]
Result: the tester will run the test in turn for each of the 10 pairs.
Example 2: sweeping several parameters at once
Let's add, on top of sweeping pairs, a sweep of the take-profit % value — from 0% to 10% in steps of 0.5 (21
values in total).
Number of combinations: 10 pairs × 21 values = 210 runs.
"parameter_mining": [
    {
        "name": "settings[*].basic.symbol",
        "start": 1.0,
        "end": 1.0,
        "step": 1.0,
        "values": [
            "1000BONKUSDT", "1000FLOKIUSDT", "1000LUNCUSDT",
            "1000NEIROCTOUSDT", "1000PEPEUSDT", "1000TAGUSDT",
            "4USDT", "AAVEUSDT", "ACHUSDT", "ADAUSDT"
        ]
    },
    {
        "name": "settings[*].options.take_profit_long",
        "start": 0,
        "end": 10.0,
        "step": 0.5,
        "values": []
    }
]
Example 3: setting up a sweep
Video walkthrough
All the bot's strategies are also available in PineScript format for testing on TradingView.